


Web Version Disaster Prevention Map / Hazard Map


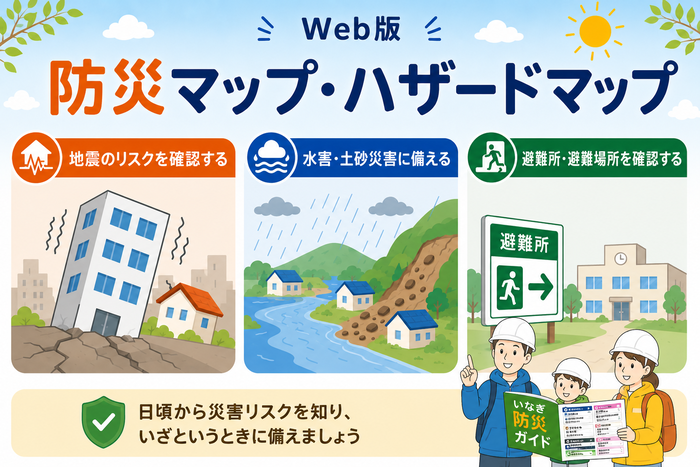
Disaster Prevention Map
What can be confirmed: seismic intensity distribution within the city, liquefaction risk, disaster prevention related facilities

Currently published
- "Seismic Intensity Distribution Map" showing the distribution of seismic intensity for the "Tama Eastern Direct Earthquake"
- Liquefaction Hazard Map indicating the risk of liquefaction
Hazard Map (Flood and Sediment Disaster)
What can be confirmed: Flood inundation assumed areas, inland water inundation assumed areas, landslide warning areas, evacuation centers and evacuation sites, etc.

Currently published
- Tamagawa Flood Inundation Assumed Area
- Misawa River Flood Inundation Assumed Area
- Inland Water Inundation Assumed Area
- Landslide (Special) Warning Area
- Flood Risk Area
-
This shows the results of simulations indicating the areas where flooding occurs and the estimated depth when heavy rain falls in the basins of each river.
- Depending on the rainfall pattern, changes in land use, and the development status of rivers and sewerage systems, flooding may occur outside the expected inundation areas, or the depth of flooding may differ.
- The duration of flooding indicates the time from when the water level reaches 0.5m or more due to flooding, until the water recedes to below 0.5m.
【What is the Tama River Flood Inundation Assumption Area?】
This shows the inundation situation in the event of flooding caused by the assumed maximum scale rainfall (total rainfall of 588mm over 48 hours in the Tama River basin) resulting in the Tama River overflowing.
【What is the Misawa River Basin Flood Inundation Assumption Area?】
This shows the inundation situation in the event of flooding caused by the assumed maximum scale rainfall (maximum hourly rainfall of 152mm and total rainfall of 690mm over 24 hours in the Misawa River basin) resulting in the Misawa River overflowing.
【What is the Inland Flood Inundation Assumption Area?】
This shows the flooding situation in the event of inland flooding caused by heavy rain with the assumed maximum scale rainfall (maximum hourly rainfall of 153mm, total 24-hour rainfall of 690mm), exceeding the drainage capacity of existing sewerage drainage facilities and waterways.
- Landslide (Special) Warning Area
- This shows on the map the "Landslide Warning Area (Yellow Zone)" and "Landslide (Special) Warning Area (Red Zone)" for landslides and debris flows, as well as designated evacuation shelters during disasters.
Please check before use
- The hazard map is a reference document based on simulation results derived from certain conditions. Therefore, it may differ from actual situations.
- The map information provided by this service does not encompass all information related to the Inagi Disaster Prevention Map and Hazard Map.
- The base map (Geospatial Information Authority tiles) may differ from the current situation.
- The elevation display uses the elevation API from the Geospatial Information Authority of Japan.
- This service has been tested on the following browsers: Google Chrome, Microsoft Edge, Firefox.
- Inagi City shall not be liable for any direct or indirect loss or damage arising from the use of this service.
- This service may change all or part of its content without prior notice. Additionally, there may be temporary interruptions to all or part of the service.
- The copyright for the disaster prevention content of this map belongs to Inagi City. Additionally, editing, processing, reproduction of this map, commercial use, use that violates various laws and regulations, and use for purposes, means, or methods that infringe on the rights of others are prohibited.
This page is managed by the Inagi City Fire Department Disaster Prevention Division
〒206-0802 2111 Higashi-Naganuma, Inagi City, Tokyo (Inagi Fire Station)
Phone number: 042-377-7119 Fax number: 042-377-0119
Contact the Disaster Prevention Division of Inagi City Fire Department